Restaurant Analytics for Delivery Sales Drops
Summary Highlights
Identify why your restaurant’s delivery orders are dropping. Use Voosh’s analytics platform to pinpoint issues fast and recover lost sales – book a demo!
If delivery sales dip for one day, maybe it is weather, a local event, or plain old randomness. If they dip for two weeks, you have an operating problem until proven otherwise. That matters more now because off-premise is not a side channel anymore. The National Restaurant Association’s latest reporting says about 75% of restaurant traffic is takeout, and 95% of consumers say speed is critical to the experience. When delivery slips, the damage shows up fast in lost orders, weaker visibility, and stressed-out teams.
The mistake a lot of operators make is jumping straight to discounts. They see a sales dip, throw money at a promo, and hope demand comes back. Sometimes that works for a weekend. It does not solve the real problem if one store quietly went soft-offline, a promotion ended, cancellations spiked, or a review cluster started dragging conversion down. And sometimes the issue is bigger than your brand: Reuters reported that restaurant visits fall as gas prices rise, with the effect getting worse once fuel crosses certain thresholds. Good restaurant analytics helps you tell the difference between a market swing and a store issue before you start sacrificing margin.
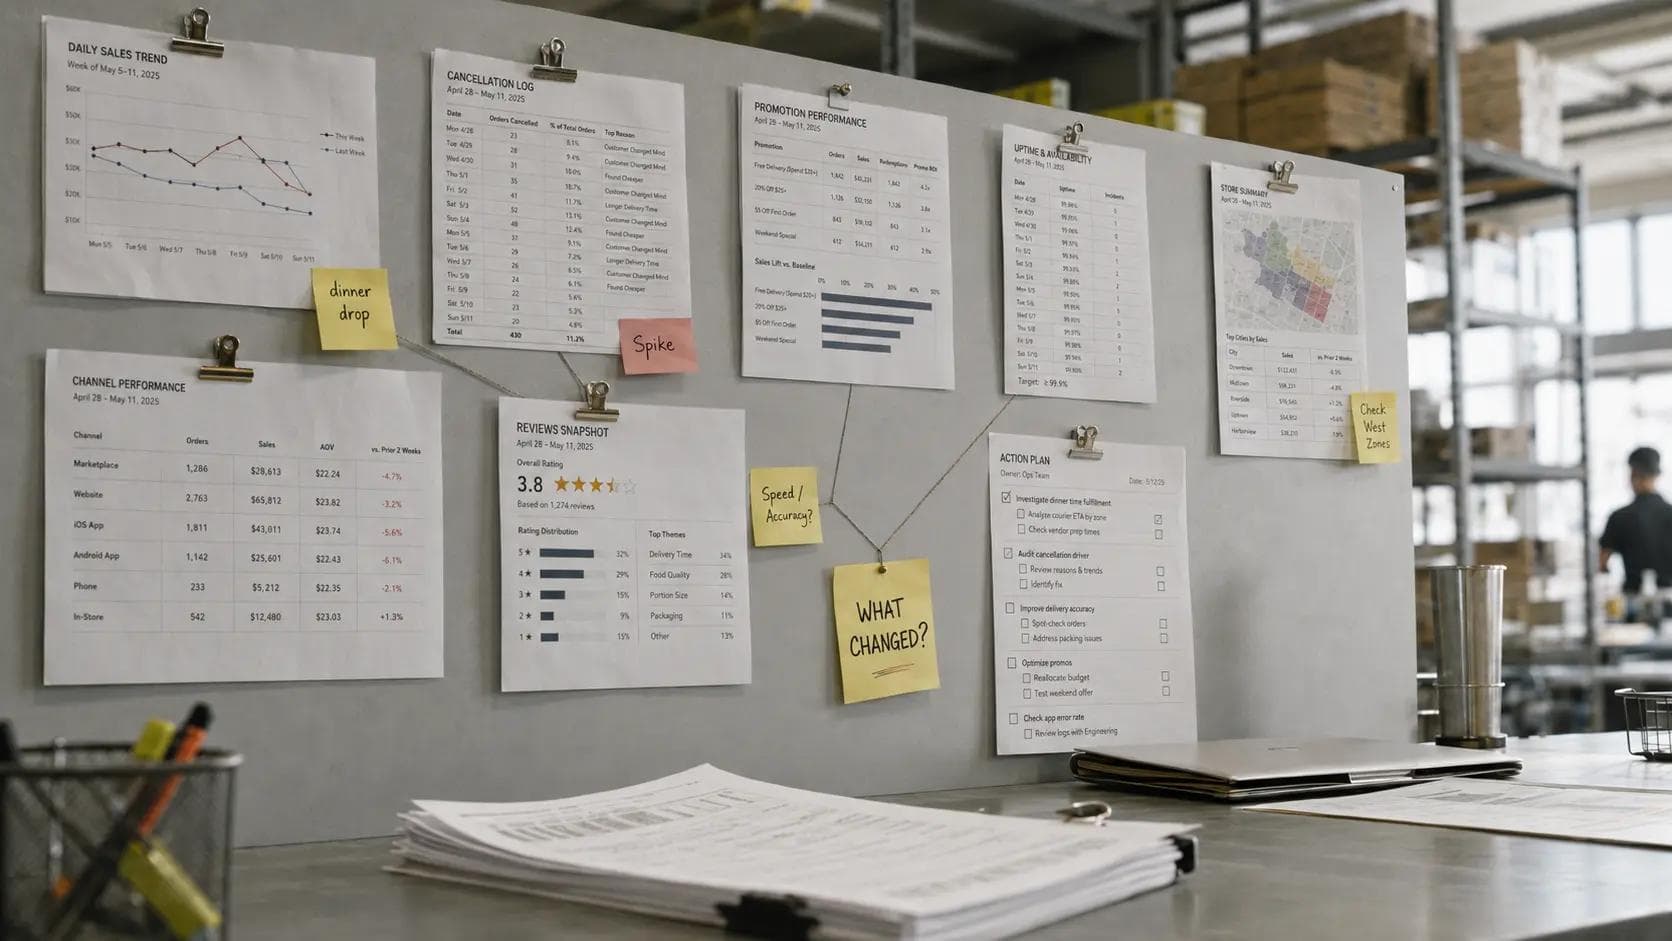
Restaurant analytics is the practice of pulling sales, uptime, cancellations, reviews, promotions, and daypart trends into one view so operators can answer three questions quickly: what changed, where it changed, and what to fix first. In delivery, that is what separates a useful system from a pretty dashboard.
What restaurant analytics should tell you in the first fifteen minutes
When sales drop, you do not need more charts. You need faster answers. VooshGPT’s current product language gets this right: it monitors sales, downtime, reviews, disputes, and payouts across marketplaces, then tells teams what changed, why it happened, and what to do next. Its Sales AI is built to track delivery sales, mix, cancellations, and marketplace performance by store, channel, and daypart. That is exactly the standard operators should use when they evaluate a delivery analytics workflow.
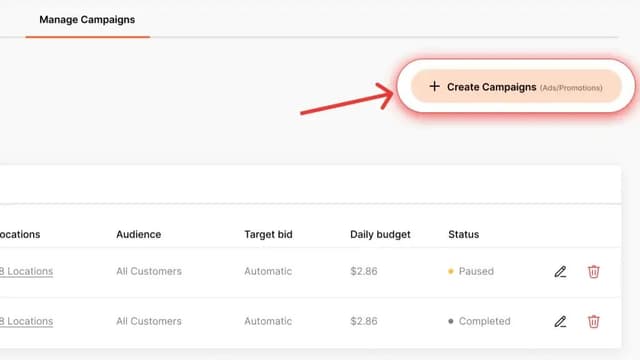
A useful delivery analytics view should answer a few basic questions right away. Did the drop happen across every marketplace or just one? Did it hit every store or just a cluster? Did dinner fall while lunch held up? Did ad orders or promo lift disappear? Did rating themes turn negative at the same time cancellations rose? Did the store become offline, paused, throttled, or just invisible in search? If your team has to open separate tools to answer each of those, the delay is part of the problem. Voosh’s public feature set is built around those exact signals: uptime monitoring and auto-reopen, review trend surfacing, promotion analytics, and plain-English AI queries on live delivery data.
The reason this matters is simple: delivery losses rarely come from one place. Voosh’s current customer stories show that clearly. One eighty-store pizza franchise used marketplace auto-reopen to recover more than four thousand orders and protect up to two percent of monthly sales, while a fifteen-location QSR used measured marketplace ads and promotions to lift delivery take-home by seven percent. Those are two completely different causes of lost revenue, and they need two completely different fixes.
Use this seven-step audit to find the real cause
Before you touch pricing, run this audit in order. Start with sellability, not discounts. That is the cleanest way to separate a real demand problem from an execution problem. Voosh’s own product set points to the same pattern: store uptime, reviews, promotions, and analytics all live close to the revenue question for a reason.
1. Check whether the store was actually sellable. Look for offline, paused, throttled, or soft-offline states. If the listing was not truly available, stop there first.
2. Check whether the problem is one channel or every channel. A single-marketplace dip usually means a ranking, integration, menu, or availability issue. A systemwide dip may be macro or promo-related.
3. Check hours, holiday settings, and menu changes. Missing hours, broken modifiers, stale availability, or bad mapping can quietly suppress orders.
4. Check what changed in ads and promos. Did a campaign end? Did spend move? Did cost per order rise while payout lift fell?
5. Check cancellations and order-quality signals. Rising cancellations, missed items, and order errors often hit sales before someone calls it a “reputation issue.”
6. Check reviews and rating themes. If guests suddenly start mentioning late orders, cold food, or missing items, conversion can slide even if the store looks “open.”
7. Check daypart and store mix. Sometimes the total looks flat, but dinner fell off at specific units while lunch or another marketplace masked it in the roll-up.
Do this in order because the most expensive response is often the wrong first response. If a store was soft-offline, a discount just pays customers to order from a broken pipe. If ad spend stayed flat but payout lift dropped, you do not have a traffic problem, you have an efficiency problem. If reviews suddenly mention speed and accuracy, you probably have an ops problem, not a creative problem.
Spot the difference between a market problem and a store problem
One of the most useful jobs restaurant analytics can do is keep your team from chasing ghosts. Sometimes demand really is down. Reuters cited restaurant-industry analysis based on 14.6 billion transactions showing that higher gasoline prices reduce restaurant visits and that the effect gets meaningfully worse once prices move above four dollars a gallon. If every store in a market drops on the same days, across every channel, during the same dayparts, that is a lot more likely to be macro than operational.
But that is not how most delivery sales drops look in the real world. Most are messier. Maybe one marketplace falls while the others hold. Maybe dinner drops in suburban stores but lunch stays stable downtown. Maybe one district starts seeing more cancellations. Maybe ad orders are still coming in, but reviews turn negative and conversion softens a week later. Those are store-level or process-level problems. They need operational fixes, not broad budget cuts.
This is where plain-English analytics helps. VooshGPT’s public examples include questions like “Where did we lose sales, and why?” and “Which stores are at risk this weekend?” That framing matters because it forces the system to connect causes, not just report totals. Good operators already think that way. Good software should, too.
Turn scattered alerts into one operating rhythm
For independent operators, this can be a ten-minute morning habit. Pull yesterday against the same weekday last week. Check whether any store was paused or offline. Look for one marketplace that broke rank with the others. Scan cancellations. Scan top review themes. Check whether any ad or promo change happened at the same time. Then assign one owner and one next step.
For multi-unit teams, the same audit should happen at two levels. Store leadership needs the local answer: what went wrong here yesterday? Regional or HQ teams need the pattern answer: which stores share the same issue, and where is the biggest revenue risk right now? That is why a signal like “sales down eight percent” is not enough. You need the second line under it: why.
Voosh’s public customer stories show how those signals stack up across categories. A two-hundred-plus-location QSR used uptime monitoring and automation to protect more than $241,000 in at-risk delivery sales and save 3,440 downtime hours in sixty days. A sixty-location fast-casual brand replied to 7,500-plus delivery reviews in ninety days after centralizing feedback. And the fifteen-location QSR example showed that once ads and promotions were measured correctly, delivery take-home rose by seven percent. That is the real operating lesson: sales drops do not live in a single tab. They show up where uptime, reputation, and promo efficiency intersect.
If you like practical cadence, use this one:
- Daily: check sellability, last-order gaps, cancellations, and fresh review themes.
- Weekly: compare daypart shifts, marketplace mix, and promo efficiency by store group.
- Monthly: decide which one root cause is costing the most gross sales, and fix that first.
That cadence is how you stop treating delivery like a pile of app logins and start treating it like an operating system.
Know what good restaurant analytics software should show
If you need four tools to explain one sales dip, that is your sign that the stack is too fragmented. The right restaurant analytics setup should show you: cross-marketplace sales in one view, store availability, cancellations, rating themes, promo efficiency, and a drill-down by store and daypart. It should also make action obvious. One click to the affected dates. One click to the store view. One click to the trend behind the dip. And ideally, one sentence that explains what changed in plain English.
That is where Voosh has a credible story to tell. The company says it now supports more than five hundred restaurant brands and has processed more than one billion dollars in delivery sales. Its AI layer sits on top of delivery marketplace data, while Marketplace Store Uptime can monitor status and auto-reopen stores, Reviews & Reputation centralizes guest feedback and surfaces trends by store and daypart, and Ads & Promotions tracks ROAS, ad orders, cost per order, and payout lift by store and channel. For an independent operator, that means fewer blind spots. For a multi-unit group, it means fewer “Can someone check the tablet?” moments.
The bigger point is not software for software’s sake. It is speed to diagnosis. The faster you can separate uptime from ranking, ranking from reviews, and reviews from promo efficiency, the faster you stop the bleed without burning margin.
Delivery sales drops usually are not mystery events. They are visible signals that went unconnected for too long. Start with sellability. Then check channel split, menu and hours, promos, cancellations, reviews, and daypart mix. If your team can answer those seven checks quickly, you will make better calls, protect more revenue, and stop reaching for discounts every time the graph turns red.
If you want to see what that looks like in one operator view, Book a demo and have the team walk you through how Voosh connects sales, uptime, reviews, and promotions so you can find the real cause faster.