How to Increase Average Order Value on Delivery Apps
Summary Highlights
Learn how to increase average order value on DoorDash, Uber Eats, and Grubhub with modifier strategy, bundles, minimum orders, and smarter menu sequencing.
How to Increase Average Order Value on Delivery Apps
Most restaurant operators chasing delivery growth focus on one number: order count. More orders, more revenue, done. It's a logical place to look - and it's also why so many operators are leaving money on the table every single day.
Average order value (AOV) - what each customer actually spends per transaction - is the quieter lever. It doesn't require more marketing spend, more platform promotions, or more customers finding you. It works on the orders you're already getting. And unlike order count, which is partly at the mercy of platform algorithms and your competition, AOV is almost entirely within your control.
This guide covers what drives AOV on delivery platforms, the five specific levers that move it, and how to track and optimize it across locations and platforms using the data you already have.
Quick definition: Average order value (AOV) on a delivery platform is total net sales divided by total number of orders for a given period, platform, and location. It measures how much the average customer spends per transaction and serves as a direct indicator of how well your menu, modifier structure, and bundle strategy are working.
What Average Order Value Actually Means on Delivery Platforms
How to Calculate Your Current AOV Per Platform
Your delivery AOV is not a single number - it varies meaningfully by platform, daypart, location, and day of week. The calculation is straightforward: total net sales ÷ total order count for the period you're measuring.
Where operators go wrong is treating their blended AOV - across all platforms, all locations, all times - as if it's a meaningful benchmark. A $34 blended AOV might look acceptable until you break it down and find that your DoorDash AOV is $38 and your Grubhub AOV is $27. Those aren't the same problem, and they don't have the same solution.
Start by pulling AOV per platform, per location, and - if your volume allows - per meal period. That segmentation is where the actual signal lives.
Why Delivery AOV Is Lower Than Dine-In - and What to Do About It
Delivery AOV tends to run lower than in-restaurant checks for predictable structural reasons. Customers ordering on an app don't have a server suggesting an appetizer, don't see the dessert display, and aren't socially nudged toward a second drink. The ambient upsell environment that drives dine-in AOV is completely absent.
What you have instead are modifier prompts, bundle structures, and the visual sequence of your menu - digital replacements for the same upsell mechanics that work in a dining room. The operators with consistently higher delivery AOV have built those mechanics thoughtfully. The ones with low AOV haven't thought about the digital experience at all - they've just listed their items.
Understanding margin per order is essential before optimizing AOV. See our guide to restaurant profit margin on delivery apps for the baseline.
The Five Levers That Move Delivery AOV
Lever 1: Modifier Architecture - the Most Underused AOV Tool
Modifiers are how customers add to their order at the item level: proteins, toppings, sauces, sizes, upgrades. Done well, they are the single most powerful AOV lever available on delivery platforms. Done poorly - or not at all - they are invisible money left on the counter.
High-AOV modifier strategy follows a few consistent principles:
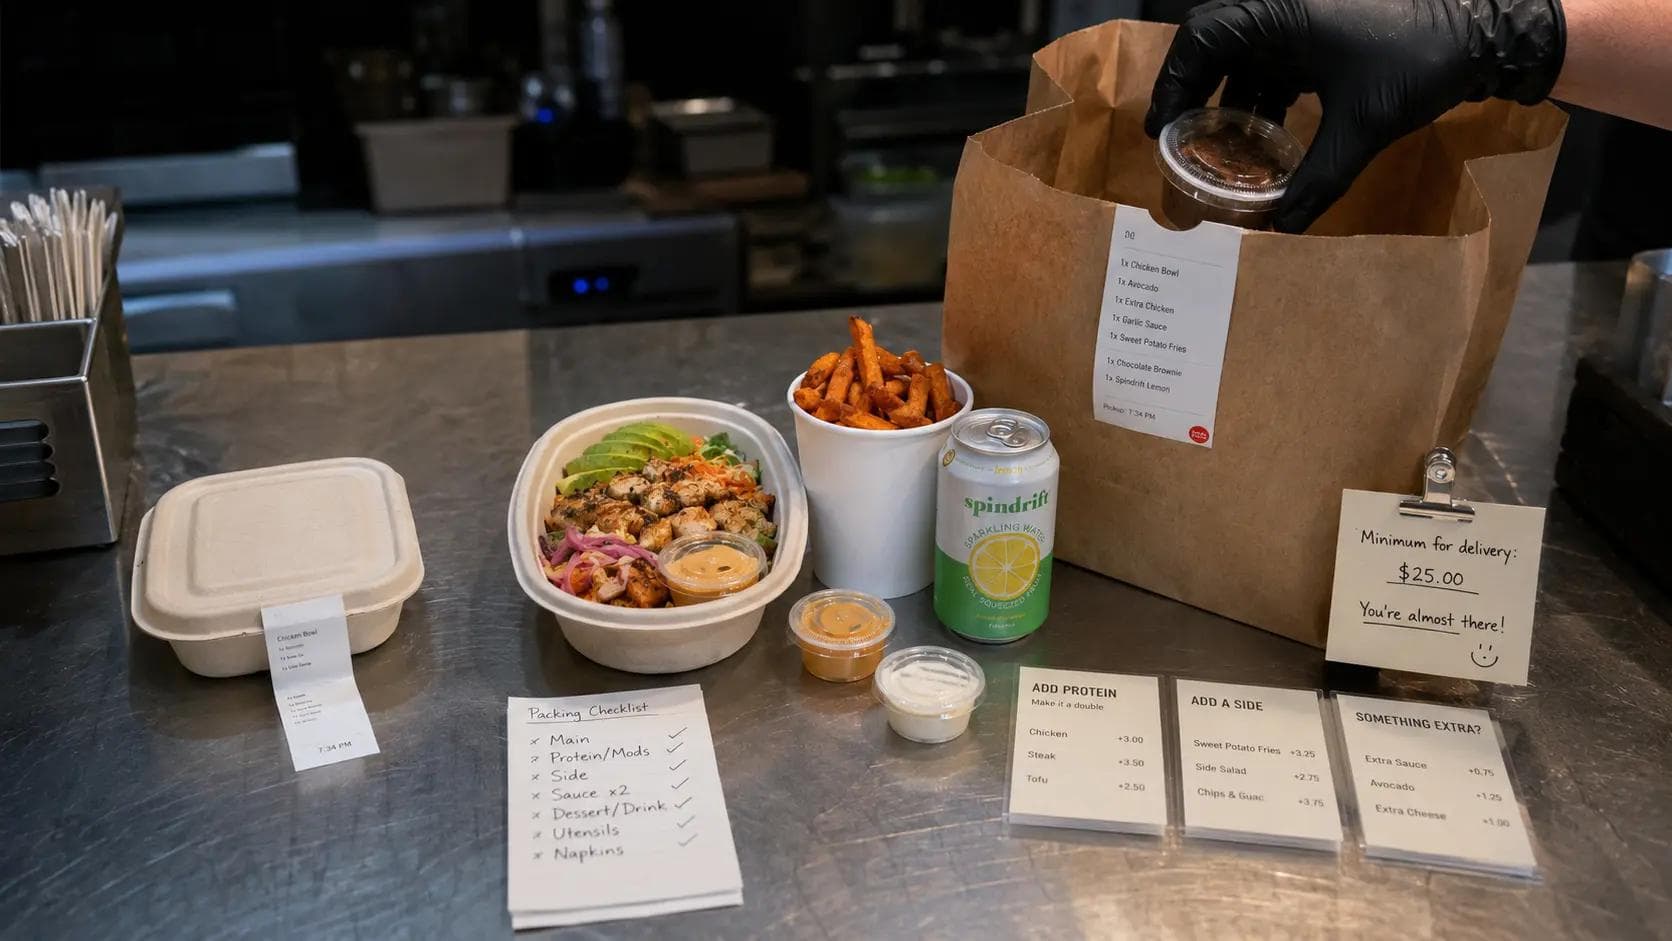
- Required modifiers force a decision, which keeps the customer engaged and frequently results in an upgrade selection. If a burger can come with regular or premium fries, making the choice required (rather than optional) consistently lifts AOV.
- Modifier groups should be sequenced intentionally - value-add selections first, customization second. Customers who engage early in the modifier flow spend more than those who see customization options first.
- Upgrade pricing should feel proportionate. A $1.50 upgrade from regular to premium feels accessible. A $5.00 upgrade for a sauce feels unreasonable. The delta matters for conversion.
- Modifier labels that describe rather than just name - 'Crispy Parmesan Upgrade: +$2.00' outperforms 'Add Parmesan: +$2.00' because it justifies the upcharge.
Lever 2: Bundle and Combo Strategy Built for Delivery
Bundles serve a dual purpose on delivery platforms: they increase AOV by packaging items the customer might not have added individually, and they simplify the ordering decision, which improves conversion rates. Both outcomes are good. The mistake is building bundles the same way you'd build a dine-in combo meal.
Delivery bundles should account for transport. A combo that includes a drink works perfectly in a physical restaurant - drinks travel poorly and typically generate more complaints than revenue on delivery. Effective delivery bundles typically pair a main, a portable side, and either a dessert or a shelf-stable add-on.
Pricing bundles at a 10-15% effective discount compared to individual item pricing tends to maximize take rate without significantly compressing margin - the volume lift offsets the per-item discount for most operators. Bundles priced at a larger discount see higher take rates but lower AOV improvement, defeating the purpose.
Lever 3: Minimum Order Thresholds - Where to Set Them
Minimum order thresholds are the platform-level setting that requires customers to reach a spending floor before their order is eligible for delivery or for a reduced delivery fee. Set too low and they have no AOV impact. Set too high and they drive abandonment.
The practical benchmark: set your minimum at roughly 10-15% above your current median order value - not your mean. Median is the better reference because it is less distorted by very large or very small outlier orders. If your median delivery order is $28, a $31-$33 minimum nudges the majority of customers to add one more item without creating a barrier for your core ordering behavior.
Review your minimum threshold every time you run a meaningful menu change. A minimum set 18 months ago likely no longer reflects your current menu structure or price points.
Lever 4: Anchor Items and Menu Sequencing
On delivery platforms, customers navigate from the top of your menu downward - they do not browse the way they would scan a physical menu. Whatever appears first gets the most attention and sets a price reference point that shapes how customers perceive everything below it.
Anchor items are your highest-revenue, best-margin items placed at the top of your menu structure: your signature proteins, your flagship bowls, your highest-value combos. When customers see these first, the lower-priced items that follow register as accessible additions rather than the primary ordering target.
The reverse is equally true: menus that lead with low-price appetizers or add-ons anchor customers to a low-spend mindset from which recovery is difficult.
Menu structure and item selection interact directly. See our guide on menu engineering for delivery apps for the foundational framework.
Lever 5: Platform-Native Upsell Features
DoorDash, Uber Eats, and Grubhub all offer native features that surface recommended add-ons at checkout or within the item detail screen. These features - DoorDash's item recommendations, Uber Eats' 'People also ordered' prompts - are opt-in from the operator side in terms of how you configure your menu to work with them.
Menus with strong item tagging, complete descriptions, and logical category grouping tend to receive better algorithmic recommendations from these native features. The platform's recommendation engine works from the structure you provide - a well-organized menu generates more relevant cross-sell suggestions than a flat list of items.
This is a zero-cost AOV lever that most operators have never explicitly optimized for.
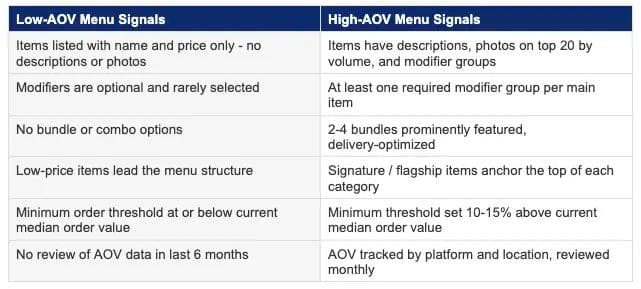
What a High-AOV Menu Looks Like vs. a Low-AOV Menu
How Platform Differences Affect Your AOV Strategy
Where AOV Tends to Vary Across DoorDash, Uber Eats, and Grubhub
Customer demographics, ordering habits, and interface design vary meaningfully across the three major delivery platforms - and those differences show up in AOV. Operators with meaningful volume across all three platforms typically see AOV spread of $4-$9 between their highest and lowest-performing platform, even with identical menus.
DoorDash tends to attract a broader demographic with more frequent, smaller-basket orders in many markets. Uber Eats skews slightly toward higher average check sizes in urban markets where customers are accustomed to higher menu pricing. Grubhub's user base varies more by geography and tends to index toward office and corporate ordering in certain markets, which can produce higher per-order values.
The practical implication: don't apply a one-size-fits-all AOV strategy across all three platforms. Your minimum order threshold, your bundle structure, and your modifier pricing might reasonably differ by platform if your volume data supports it.
Multi-Location Operators: Track AOV by Location, Not Just Portfolio
This is where portfolio-level reporting becomes a liability rather than an asset. A blended AOV of $33 across 20 locations obscures the fact that 6 locations are averaging $27 and dragging the number down while 4 locations are at $40 and masking the underperformers.
Each of those underperforming locations has a specific diagnosis - different modifier structure, different menu sequence, different minimum threshold, different bundle coverage - that cannot be identified from an aggregate number. You need location-level AOV data, broken out by platform, to find the operational differences that explain the gap.
For multi-location brands with more than 5 stores, reviewing AOV at the portfolio level is useful for spotting trends. Acting on it requires location-level breakdowns. The two are not interchangeable.
For context on managing performance data across locations, see the multi-unit delivery operations guide.
Using Delivery Data to Set AOV Targets and Measure Progress
Before you make any menu changes aimed at AOV improvement, pull your current state data: AOV per platform, per location, for the last 90 days. That is your baseline. Without it, you will not be able to tell whether the changes you make are working.
Set a target based on your modifier and bundle opportunity - not an arbitrary percentage. If your current AOV is $30 and your best-performing location with a fully configured modifier structure averages $36, $34-$35 is a reasonable 60-day target for your underperforming locations if you implement the same structure.
Review AOV weekly in the first four weeks after making changes, then monthly once you've established a new baseline. Specific signals to watch: modifier take rate (the percentage of orders that include at least one paid modifier), bundle order share (percentage of orders including a bundle), and average items per order.
Tracking AOV sits alongside a broader set of delivery performance metrics. See our guide to food delivery KPIs to track for the full measurement framework.
Voosh data (2025): Restaurants that actively track AOV by platform and location and implement modifier and bundle changes based on that data see an average AOV improvement of 12–18% within 90 days. For a restaurant doing 150 delivery orders per day at a $30 AOV, a 15% improvement represents roughly $16,400 in additional monthly revenue without a single new customer.
The AOV Optimization Checklist
- Pull your current AOV per platform and per location. Identify your bottom quartile of locations by AOV.
- Audit your modifier groups on your lowest-AOV locations. Count how many items have required modifiers. If the answer is zero or one, that's your starting point.
- Build or review your bundle offering. Confirm bundles are delivery-appropriate (no liquid-heavy or temperature-sensitive items), priced at a 10-15% effective discount, and visible in the top section of your menu.
- Check your minimum order threshold against your current median order value. Adjust if the gap is less than 10%.
- Review your menu sequence. Flagship and high-margin items should lead every category.
- Set a 60-day AOV target for each underperforming location based on your best-performing comparable location.
- Review modifier take rate, bundle order share, and average items per order weekly for the first month.
Conclusion
Average order value is one of the most direct, controllable revenue levers in delivery operations - and one of the least actively managed. Most operators have never explicitly optimized their modifier structure, sequenced their menu for anchoring, or set a minimum threshold with current data. The opportunity that creates is consistent across location count, platform mix, and cuisine type.
The operators growing delivery revenue efficiently aren't just acquiring more customers - they're getting more value from each order that already comes in. That starts with knowing your current AOV, understanding what drives it, and making deliberate changes to the menu levers that move it.
Want to see your AOV by location and platform in one dashboard?
Book a demo with us → voosh