Delivery Order Errors: What They Really Cost and How to Reduce Them
Summary Highlights
Missing and wrong items cost more than a refund. Learn how to measure your delivery order error rate, diagnose root causes, and build systems that stop errors at scale.
Delivery Order Errors: What They Really Cost and How to Reduce Them
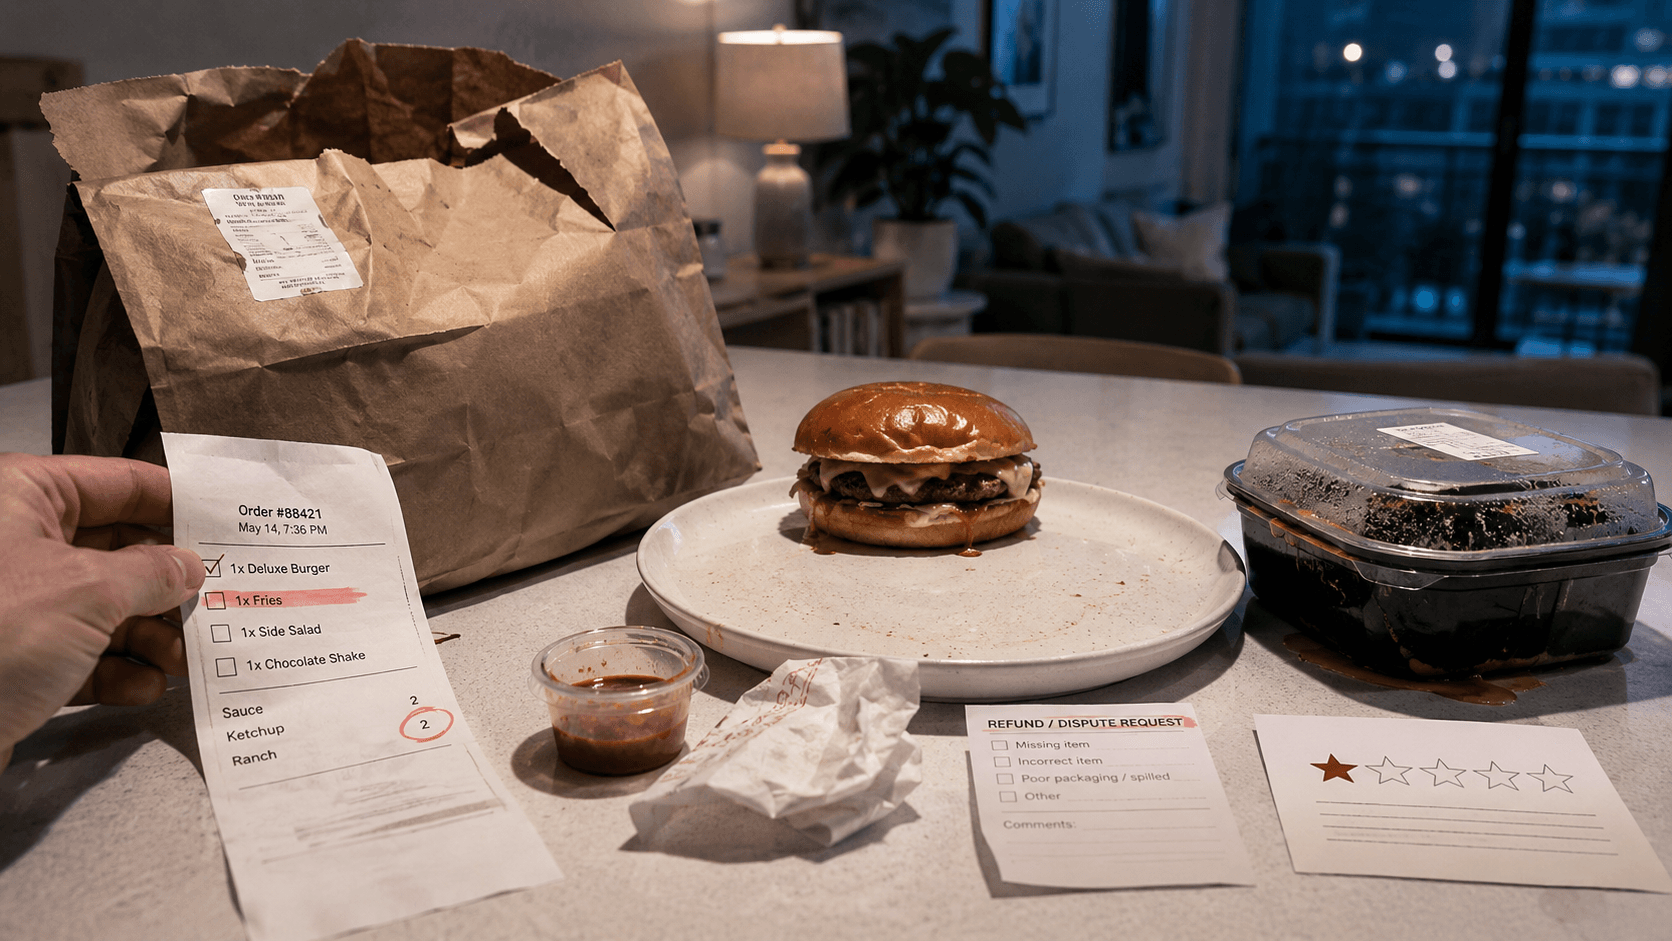
A customer opens their order bag and finds the burger is there but the fries aren't. They don't call the restaurant. They tap the dispute button, leave a one-star review, and in most cases never order from you again.
That interaction - which takes the customer about 90 seconds - costs your restaurant more than most operators realize. There's the refund. There's the platform's dispute processing fee on top of it. There's the review that will sit on your listing for months, suppressing your star rating and your algorithmic rank. And there's the customer you just lost, who was worth several hundred dollars in lifetime delivery revenue.
This guide breaks down the full cost of delivery order errors, how to find your actual error rate across platforms, the six root causes that account for most incidents, and what a prevention system looks like that holds when you're running 20 locations across three platforms.
Quick definition: A delivery order error is any incident in which the customer receives an order that does not match what they placed - including missing items, incorrect items, wrong quantities, unrequested substitutions, or items in an unsatisfactory condition due to packaging failure. Platforms track these under labels including 'order issues,' 'customer reports,' or 'error rate,' and they feed directly into your restaurant's quality score and dispute rate.
What Counts as a Delivery Order Error?
The Four Error Types Platforms Track
- Missing item - an item confirmed in the order was not included in the bag. The most common error type by volume across all three platforms.
- Incorrect item - the customer received something different from what they ordered: wrong protein, wrong size, wrong variation.
- Wrong quantity - the correct item was included but in the wrong count: one entree when two were ordered, three sauces when one was specified.
- Condition issue - the item arrived but was unsatisfactory due to packaging failure: spilled, crushed, or otherwise unusable on arrival. Platforms categorize this differently across DoorDash, Uber Eats, and Grubhub, but it typically falls under order quality reports.
Each type triggers a different resolution path - some result in automatic refunds, some require dispute submission, some affect your error rate metric without generating a refund if the customer does not report. The ones that go unreported are still damaging: they generate 1-star reviews and one-time customers who do not come back.
Why 'Missing Items' Dominates the Error Landscape
Missing items account for a disproportionate share of delivery complaints across the industry for a simple operational reason: delivery bags are packed under pressure, at volume, by kitchen staff who also have dine-in tickets and pickup orders competing for attention. A fries order sitting in the window gets grabbed with the correct bag 95% of the time. The other 5% produces a dispute, a review, and a refund.
At 100 delivery orders per day, a 5% missing-item rate means five errors daily. That's 150 per month - each one generating some combination of refund cost, review damage, and dispute fee. The math on doing nothing about it is straightforward.
When errors do happen, the dispute process matters enormously. See our guide to how to win delivery app refund disputes for the resolution framework.
The Full Cost of One Order Error
Direct Costs: Refunds and Dispute Fees
The direct cost of a missing-item error is the refund issued to the customer. On most platforms, this is processed automatically when the customer reports the error - the restaurant's payout is debited without a manual review for lower-value items. For higher-value claims, a dispute process applies, but even a successful dispute typically returns only a portion of the debited amount.
On top of the refund, some platforms charge an error processing fee - a flat or percentage-based charge for handling the customer complaint. The specific fee structure varies by platform and tier, but the net effect is that a $12 missing-item refund can cost the restaurant $14-$16 in total direct charges when fees are included.
Indirect Costs: Review Damage and Ranking Impact
The indirect costs are harder to quantify but larger in practice. A customer who receives a wrong or incomplete order and reports it is significantly more likely to leave a one-star review than a customer who has a neutral experience. Those reviews accumulate in your listing's star rating - visible to every potential customer who sees your store in search results.
Platform ranking algorithms weight your order quality score, which includes your error rate, alongside your rating and on-time performance. A sustained error rate above platform thresholds suppresses your restaurant in search results and reduces how often you appear in algorithm-driven placements like top picks and sponsored suggestions. That visibility loss translates directly to fewer orders - from customers who never even saw your listing.
For context on how quality metrics affect platform visibility, see our guide to how to rank higher on delivery apps.
The Compounding Effect at Scale
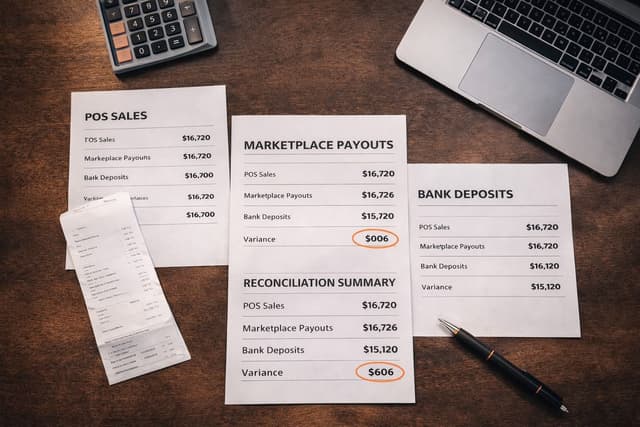
Voosh data (2025): For a 20-location restaurant brand averaging 80 delivery orders per day per location, a 4% error rate generates roughly 1,920 monthly errors. At an average combined direct cost of $15 per error (refund + fees), that is $28,800 per month in direct charges alone - before accounting for review damage, ranking suppression, and lost repeat customers. Reducing that error rate to 1.5% saves approximately $19,200 per month.
How to Find Your Actual Error Rate
Where Each Platform Surfaces It
- DoorDash Merchant Portal: Navigate to Operations Quality. Your error rate appears as a percentage of orders that received a customer complaint related to order accuracy. The portal also breaks down complaint volume by category - missing items, wrong items, etc.
- Uber Eats Manager: Under Restaurant Operations Score, order accuracy is one of four scored dimensions. Uber Eats also provides an 'Order Issues' section that shows error volume and type over a selectable time window.
- Grubhub for Restaurants: Your Restaurant Report Card includes an order accuracy grade. The detailed report shows complaint volume by issue type, allowing comparison across locations for multi-unit operators.
What a Healthy Error Rate Looks Like vs. a Problem Rate
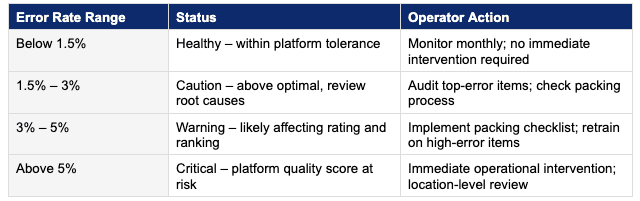
These ranges are directional, platforms do not publish their exact thresholds. Your error rate on each platform may not be identical, and the gap between platforms is itself diagnostic. A 2% error rate on DoorDash and a 6% rate on Uber Eats at the same location suggests a process that breaks down under different order volumes or interface conditions, not a kitchen-wide problem.
The Six Root Causes of Delivery Order Errors
Most delivery errors trace back to one of six operational failures. Identifying which ones apply to your specific locations is the prerequisite to fixing them.
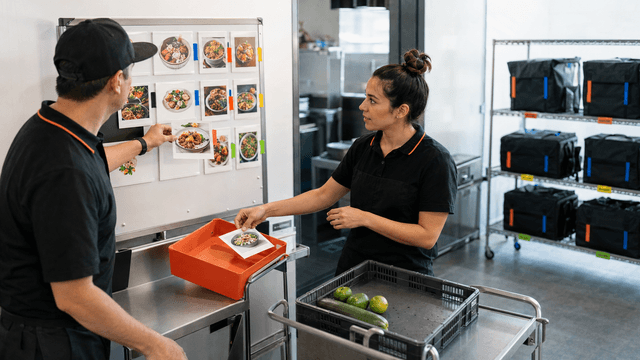
- Bag-packing omission under volume pressure. Kitchen staff pack delivery bags while managing dine-in tickets, pickup orders, and walk-ins simultaneously. Items that require a separate trip to a different station - sauces from a cold well, drinks from the bar, desserts from a pastry station - are the most frequently missed. This is a process design problem, not a staff competence problem.
- Modifier blind spots. An item with five modifier options has five opportunities for an error. If the kitchen display system surfaces modifier details inconsistently, or if modifier tickets are printed separately from the main ticket, modifiers are systematically missed. Checking where modifier details appear in your kitchen flow usually reveals the gap immediately.
- LTO and 86 lag. A limited-time item that was removed from the menu but still active in the KDS creates fulfillment confusion. Staff who haven't been briefed on the 86 will attempt substitutions rather than escalating - which generates wrong-item complaints, not missing-item ones.
- Cross-order contamination. At high volume, bags from multiple orders staged in the same area get mixed. A sealed bag's contents are assumed correct without verification. This is a staging and labeling problem: if bags aren't labeled with order numbers and station-checked before sealing, cross-contamination errors are almost inevitable at peak.
- Packaging failure on transit-sensitive items. Items that travel well in-restaurant (open cups, plated items) can fail on delivery. If your packaging hasn't been explicitly evaluated for a 20-minute transit - lid security, container closure, stacking order - condition complaints will look like quality complaints when they're actually packaging failures.
- No closed-loop verification before handoff. In operations without a final check step before handing a bag to a driver, errors only surface when the customer opens the bag. Adding a single verification step - even a visual scan against the printed receipt - catches a meaningful percentage of errors before they leave the building.
Building an Error Prevention System That Holds at Scale
The Packing Checklist: The Cheapest Fix Available
Before any tech investment or process redesign, a laminated packing checklist at each bag-sealing station eliminates a material share of missing-item errors. The checklist lists every item category for the order - mains, sides, sauces, drinks, condiments, utensils - and the person sealing the bag confirms each is present before closure.
Implementation is a single training session and a printing cost. Operators who add this step consistently report error rate reductions of 30-50% within the first two weeks, specifically for missing-item complaints. It requires no new equipment and no software.
Station Separation and Delivery-Only Packaging
High-error operations typically share the same production flow for dine-in, pickup, and delivery. When all three compete for the same kitchen real estate simultaneously, delivery bags get assembled from memory under time pressure rather than systematically.
Separating a dedicated delivery staging area - even a counter section with labeled slots - reduces cross-order contamination and gives the person sealing the bag a single-purpose zone where verification is expected rather than incidental. Pairing this with delivery-specific packaging (containers evaluated for 20-minute transit, not just for table service) reduces condition complaints without changing recipes or preparation methods.
Menu and item configuration upstream also affects error rates. A clean listing reduces modifier ambiguity. See our delivery app listing audit for the configuration layer.
Item-Level Error Tracking by Shift and Staff
Generic error rates tell you there is a problem. Item-level error data tells you where it is. Platforms surface error volume by order, but operators need to translate that into error volume by item and by time window.
A simple internal log - one column for the error type, one for the item, one for the shift - run for two weeks produces actionable data. If your missing-item complaints cluster around your house salad, your seasonal side, and a specific modifier, you know exactly what to fix. If they cluster around the Friday dinner rush, you know the issue is volume-driven rather than item-specific.
Multi-Location Operators: Spot Your Highest-Error Locations Fast
This is where blended error rates become genuinely dangerous. A 2.8% portfolio-wide error rate sounds manageable. If it's composed of twelve locations at 1.2% and two locations at 9.4%, the blended number is concealing an emergency.
Multi-unit operators need error rate visibility at the location level, broken out by platform, to identify which stores have a real problem versus which are performing well. The two high-error locations need immediate operational review. The twelve healthy locations need monitoring, not intervention. You cannot make that distinction from a portfolio average.
The secondary benefit of location-level error data: your best-performing location is a blueprint. If Location A has a 1.1% error rate on the same menu as Location F at 7.2%, the operational difference between them - staging setup, packing process, checklist discipline, staff training - is a proven fix, not a hypothesis.
For the broader framework on managing delivery performance across locations, see the multi-unit delivery operations guide.
How Smarter Data Surfaces Error Patterns Before They Compound
Manual error tracking has a ceiling. You can run a packing log for two weeks, identify the problem items, fix the process, and see improvement - but staying ahead of error rate drift at scale requires ongoing visibility, not a periodic audit.
Voosh aggregates order accuracy data, dispute activity, and customer review signals from DoorDash, Uber Eats, and Grubhub into a single dashboard. For multi-unit operators, this means seeing which locations are trending toward a higher error rate before it compounds into a rating problem - without logging into three separate platform portals and building a spreadsheet to compare them.
When a location's error rate starts climbing, Voosh's dispute manager also surfaces the financial impact in real time: which incidents triggered refunds, what the total cost is, and whether dispute submissions are recovering any of it. That connection between error rate trend and financial cost is what turns a metric into a decision.
Error-driven disputes are recoverable when they're managed correctly. See our delivery app refund disputes guide for the full process.
Voosh data (2025): Restaurant locations that actively track order error rates at the item and shift level - and implement targeted prevention measures based on that data - reduce their error rate by an average of 55% within 60 days. Locations that implement prevention measures without item-level data see an average 20% improvement over the same period. The diagnosis layer is what drives the delta.
The Error Reduction Checklist
- Pull your current error rate from each platform's merchant portal. Note whether it's above 3%. Flag any location above 5% for immediate review.
- Compare error rates by platform for the same location. A significant gap between platforms is a process signal, not a random variance.
- For your highest-error locations, start a two-week item-level error log. Record the error type, item involved, and shift time for every complaint.
- Implement a packing checklist at every delivery bag-sealing station. This is your fastest return on effort.
- Review your modifier flow in the KDS. Confirm modifier details appear on the same screen as the main item - not on a separate ticket.
- Evaluate your delivery packaging for transit performance. If you haven't tested how your containers hold up after 20 minutes in a delivery bag, do it this week.
- For multi-location operators: rank your locations by error rate. Your lowest-error location is your process benchmark for the rest.
Conclusion
A missing item feels like a small problem. At the scale of a delivery operation running hundreds of orders per week, across three platforms and multiple locations, small problems are actually compounding losses - in direct refund costs, dispute fees, review damage, and the platform ranking suppression that follows.
The good news is that most delivery order errors are preventable with process changes that cost very little to implement. The packing checklist, the dedicated staging area, the modifier flow audit - none of these require new equipment or software. What they require is visibility into where your errors are actually coming from, so you know which fix to make first.
Want to see your order error rate by location and platform in one place?
Book a demo with us → Voosh