Restaurant Benchmarking: Compare Delivery Locations Fairly

Summary Highlights
Use restaurant benchmarking to compare delivery locations fairly, find real performance gaps, and turn store-level outliers into focused action. Start here.
Restaurant Benchmarking: Compare Delivery Locations Fairly
Your highest-sales location may not be your best-run location.
It may operate longer hours, sit in a denser delivery market, or receive more marketplace demand. A smaller store can produce more orders per open hour, cancel fewer orders, and earn stronger ratings - then still land near the bottom of a raw sales ranking.
That is the problem restaurant benchmarking should solve. Done well, it separates scale from execution. Done poorly, it turns a spreadsheet into a blame list.
Here is how to compare delivery performance fairly and turn real outliers into action.
What is restaurant benchmarking?
Restaurant benchmarking is the practice of comparing performance against a consistent reference point: another location, a peer group, an earlier period, or an industry range. For delivery operations, fair benchmarking uses comparable stores and normalized rates - such as orders per open hour or cancellations per 100 orders - so teams act on operating differences, not scale alone.
There are four useful reference points:
- Internal benchmark: Compare similar locations in the same brand.
- Historical benchmark: Compare a store with its own prior performance.
- Channel benchmark: Compare the same location across delivery platforms.
- External benchmark: Compare with a credible industry or segment range.
Start with internal data, where definitions and operating context are easier to verify.
Why do raw location rankings mislead operators?
Raw sales tells you which store sold the most. It does not tell you which team executed best.
Six factors commonly distort the ranking:
- Market demand: A dense urban area can generate more demand than a smaller suburb.
- Open hours: A longer schedule creates more chances to take orders.
- Store maturity: A new location should not share a baseline with a mature unit.
- Channel mix: One store may benefit from a marketplace campaign.
- Promotions: An offer can lift orders while changing order value and customer mix.
- Sample size: One cancellation in 20 orders creates a volatile 5% rate; ten in 1,000 creates a steadier 1%.
The 2025 Off-Premises Restaurant Trends report found that 37% of U.S. adults order delivery weekly. Location comparisons now need the same discipline operators apply to dine-in performance.
How do you benchmark delivery locations fairly?
Use this eight-step process:
- Define the decision. State what the comparison should help you decide.
- Build a peer group. Match stores by concept, market, maturity, volume band, and channel mix.
- Align the time window. Use the same dates, weekdays, dayparts, and open-hour rules.
- Check data quality. Flag missing channels, closures, tiny samples, and incomplete hours.
- Normalize the metrics. Use rates per order or per open hour where scale would distort the result.
- Use medians and quartiles. Show the middle and the spread, not only the average.
- Add operating context. Annotate promotions, local events, weather, staffing gaps, and outages.
- Assign an action and review date. Name the owner, test, expected signal, and next check.
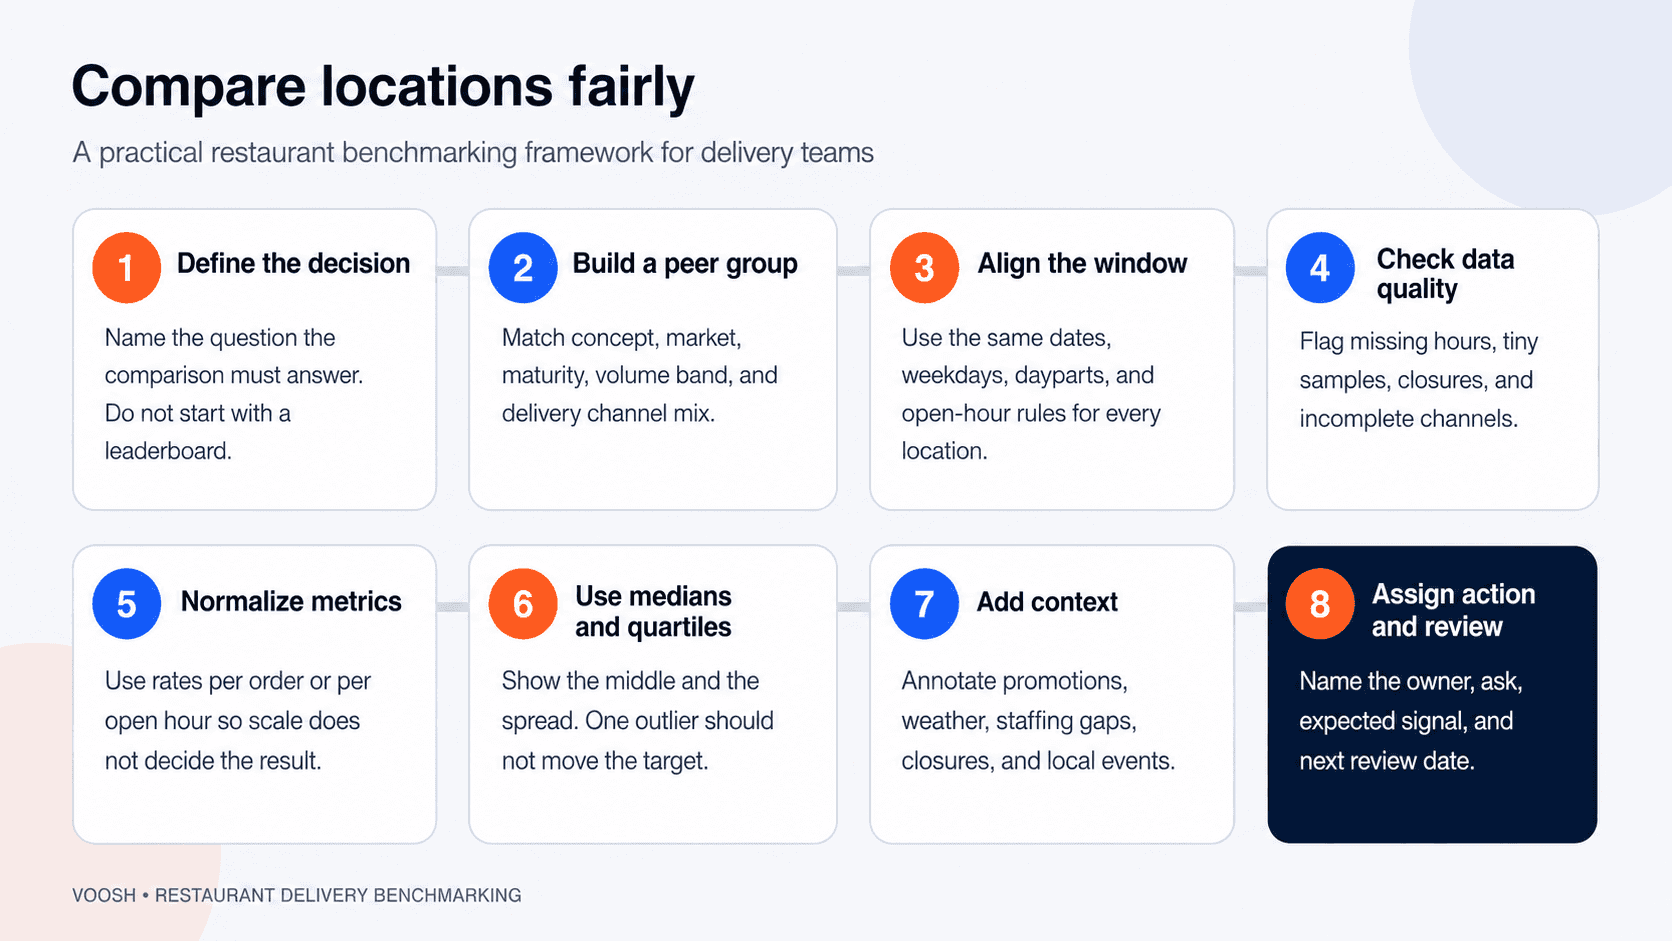
Start with the decision because the same metric can support different conversations. A regional manager deciding where to coach needs a different view from a marketing lead deciding where to run an offer.
Which delivery metrics belong in the benchmark?
A useful scorecard balances volume, reliability, customer experience, and commercial performance.
Which productivity metrics show demand relative to opportunity?
- Orders per open hour: delivered orders divided by marketplace open hours.
- Sales per open hour: delivery sales divided by marketplace open hours.
- Average order value: delivery sales divided by completed orders.
These metrics reduce the advantage of longer schedules, but different daypart models may still need separate groups.
Which reliability metrics show preventable friction?
- Cancellation rate: canceled orders divided by accepted orders.
- Store uptime rate: time available to receive orders divided by scheduled marketplace hours.
- Order-issue rate: confirmed delivery order issues divided by completed orders, when consistently available.
- Prep or wait-time signal: use the same platform definition across every store.
If a definition changes by source, compare within that source or document the difference.
Which customer signals show repeated experience gaps?
- Average rating by location and platform.
- Share of one- and two-star reviews.
- Complaint themes such as missing items, cold food, long waits, or packaging failures.
- Review volume, because a 4.2 rating from 12 reviews is not as stable as a 4.2 from 1,200.
Use a restaurant dashboard for delivery operators to keep the scorecard balanced. A store with strong sales and high cancellations is not simply a top performer; it is a high-volume operation with a reliability problem.
How do you normalize restaurant metrics?
Normalization means expressing results on a common basis.
Use per-open-hour metrics for different schedules and per-order rates for different volumes. Keep the numerator and denominator within the same date range, store, platform, and order population.
For example:
- Orders per open hour = completed delivery orders ÷ marketplace open hours
- Cancellations per 100 accepted orders = canceled orders ÷ accepted orders × 100
- Low-rating share = one- and two-star reviews ÷ total reviews × 100
Total sales still matters for resource allocation. Show scale and execution side by side.
Consistent definitions are the foundation of useful delivery sales analytics. Keep a one-page metric dictionary that states the source, formula, exclusions, refresh cadence, and owner for every benchmark.
Why should you use medians and quartiles?
The median - the middle value when stores are sorted - is less affected by one extreme result than the average.
Quartiles divide the group into four parts. They help teams see the performance spread:
- Top quartile: the strongest 25% for the metric.
- Middle 50%: the normal operating range.
- Bottom quartile: the 25% that deserve investigation.
Bottom quartile should mean “inspect,” not “punish.” Add a minimum sample rule and mark low-volume locations “insufficient sample” until they clear an agreed threshold.
The Operator’s Guide to Restaurant Benchmarking makes an important distinction: a benchmark shows the reference point; a KPI measures progress toward a goal. Use both. A store can sit below the peer median today and still be on track if its trend is improving.
How should multi-unit brands build peer groups?
Start with these filters:
- Same brand or operating concept.
- Similar service model and menu complexity.
- Comparable market type: urban, suburban, small town, campus, or travel hub.
- Similar store maturity.
- Similar delivery order-volume band.
- Similar operating-day and daypart mix.
- Similar marketplace mix.
Do not make the group so narrow that every store becomes unique. Choose the two or three factors most likely to affect the metric, and write the rule before viewing results.
How can an independent restaurant benchmark fairly?
Use your own restaurant as the peer:
- Compare the last four complete weeks with the prior four.
- Compare Mondays with Mondays, not Mondays with Saturdays.
- Compare lunch, dinner, and late night separately.
- Compare each delivery platform using the same period.
- Use a rolling median to reduce the effect of one unusual day.
- Annotate closures, promotions, weather, holidays, and local events.
Set the baseline, make one operating change, and watch the metric that should respond.
What does a fair comparison look like?
Consider this illustrative four-week example:
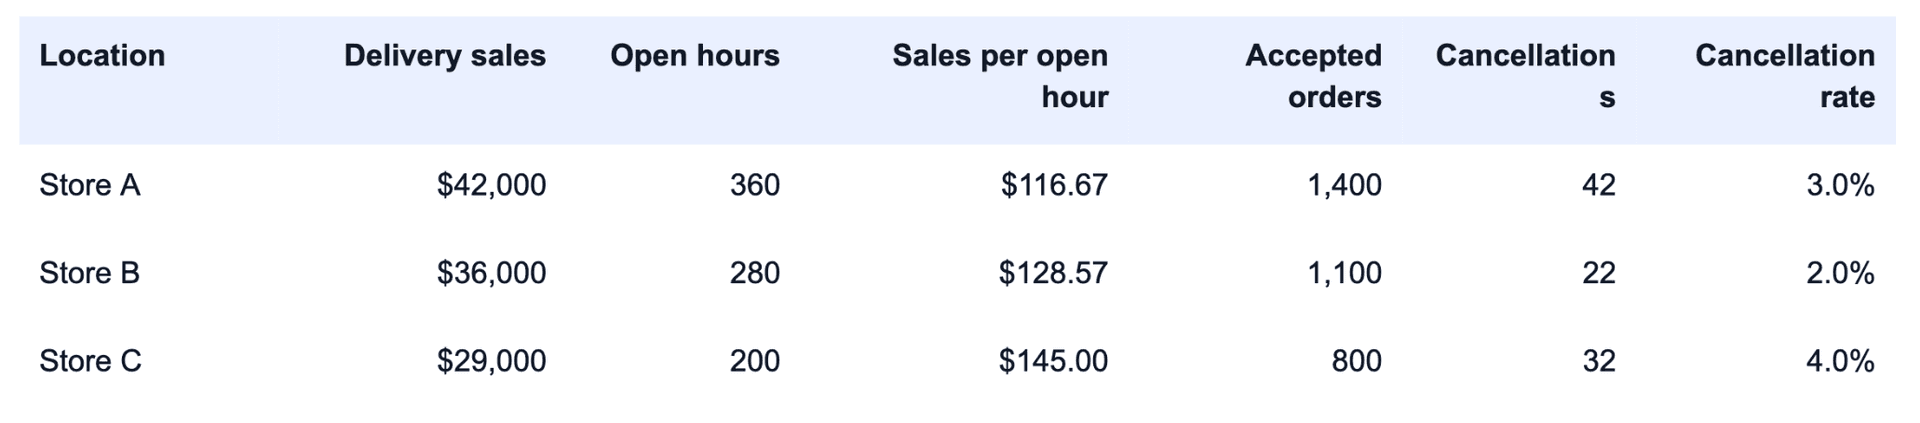
Store A leads in total sales. Store C leads in sales per open hour. Store B has the lowest cancellation rate.
There is no single winner.
If the decision is where to add operating hours, Store C deserves a closer demand and capacity review. If the decision is where to investigate cancellations, Store C is also the concern. If the decision is which team may have a reliable acceptance and fulfillment routine worth studying, Store B is the better starting point.
That is what good benchmarking does: it turns “Which store is best?” into a more useful question.
How do you turn an outlier into action?
Ask:
- Did the metric change suddenly or gradually?
- Is the gap present on every delivery platform?
- Is it concentrated by daypart, weekday, or menu category?
- Did scheduled marketplace hours match actual availability?
- Was a promotion, outage, closure, or staffing issue active?
- Is the denominator large enough to trust?
- What does the stronger peer do differently?
Then choose one test. If a peer group has a prep-time gap, review delivery app prep time optimization, change the relevant operating input where appropriate, and remeasure the cohort. Check context before copying a top store’s practice.
What should a weekly benchmark review include?
Keep the meeting to 30 minutes:
- Five minutes: Confirm data coverage, closures, and unusual events.
- Ten minutes: Review the top and bottom quartile by two or three priority metrics.
- Ten minutes: Choose no more than three outliers for investigation.
- Five minutes: Assign an owner, action, expected signal, and review date.
Maintain a simple decision log:

If a benchmark creates no action, narrow the report or the meeting.
How can Voosh support location benchmarking?
Fair benchmarking is difficult when each delivery platform has its own portal, definitions, filters, and export.
Voosh helps restaurant teams centralize third-party-delivery performance data and view relevant signals by store and channel. That makes it easier to compare consistent periods, spot outliers, and move from a brand-level number to the location or platform that needs investigation.
Voosh does not replace the operating context only a local team can provide. It also should not be presented as a source of external peer benchmarks unless that capability is specifically confirmed for the customer. Its value here is giving the team a clearer internal comparison layer and reducing the work required to assemble it.
Which benchmarking mistakes should teams avoid?
- Ranking stores by raw sales alone.
- Comparing different date windows or incomplete weeks.
- Mixing scheduled hours with actual marketplace availability.
- Comparing new stores with mature stores without a ramp period.
- Treating different platform definitions as identical.
- Using percentages without showing the sample size.
- Moving the cohort rules after seeing the result.
- Reporting an outlier without an owner or review date.
The 2026 State of the Restaurant Industry highlights persistent cost pressure, uneven traffic, and increased operator interest in digital ordering, automation, and data analytics. That environment makes disciplined comparisons more useful than another leaderboard.
Compare fairly, then investigate locally
Start with a real question. Compare like with like. Put totals beside normalized rates, show sample size, add local context, assign one action, and measure again.
If your delivery data is split across platforms and locations, Voosh can help your team see the internal comparison more clearly.
Book a demo to see how Voosh can support store- and channel-level delivery analysis.