Restaurant Demand Forecasting for Delivery Orders
Summary Highlights
Forecast delivery orders by store, marketplace, and daypart with a practical weighted baseline, clean adjustment rules, scenario ranges, and accuracy metrics.
Restaurant Demand Forecasting for Delivery Orders
Most restaurant forecasts start with one daily sales number. That is usually too blunt for delivery.
A location can finish Tuesday close to plan while dinner delivery misses badly. Promotions, outages, and marketplace shifts can distort the baseline and hide the actual workload.
This matters because delivery is no longer a side channel. The National Restaurant Association reports that nearly three-quarters of restaurant traffic happens off-premises. Its May 2026 survey also found that, among restaurants offering third-party delivery, 63% of limited-service and 41% of full-service operators are available on three or more platforms. (National Restaurant Association; May 2026 survey)
A useful forecast has to reflect demand moving through separate systems.
What is restaurant demand forecasting for delivery orders?
Restaurant demand forecasting is the process of estimating future orders, sales, and workload from historical patterns plus known factors such as promotions, holidays, weather, and local events. For delivery, the useful forecast is not one restaurant-wide number. It is a forecast by location, marketplace, and daypart that teams can compare with actual results.
A forecast is not a target. A target says what the business wants to achieve. A forecast says what is likely to happen under current conditions.
If a location’s target is above the clean forecast, the team needs a plan to close the gap. Entering the target into a spreadsheet does not make it demand.
For most operators, the best starting unit is:
Location x marketplace x daypart x orders
Forecast order count first because orders create kitchen workload. Then estimate sales by multiplying expected orders by a realistic average order value for that same channel and daypart.
Why should delivery demand be forecast separately?
Delivery does not move exactly like dine-in or pickup.
Marketplace ranking can change visibility. Promotions can pull demand into one channel. A store can be paused while the dining room remains busy. Cancellations can reduce completed orders without reducing kitchen touches. Weather may push people from dining out to ordering in, but the effect will vary by concept, item, and market.
A 2024 restaurant-chain study in the International Journal of Forecasting tested internal and external data with machine-learning and deep-learning models, reinforcing a practical point: data selection matters as much as model choice. (International Journal of Forecasting)
The goal is not to build the fanciest model. It is to stop feeding obvious distortions into a simple one.
Which signals belong in a delivery forecast?
Start with signals you can explain and maintain.
Clean delivered-order history
Use completed orders by location, marketplace, weekday, and daypart. Keep sales and average order value beside order count, but do not let revenue alone drive the forecast. Ten large family orders and 25 single-meal orders can produce similar sales with very different kitchen pressure.
Store availability and downtime
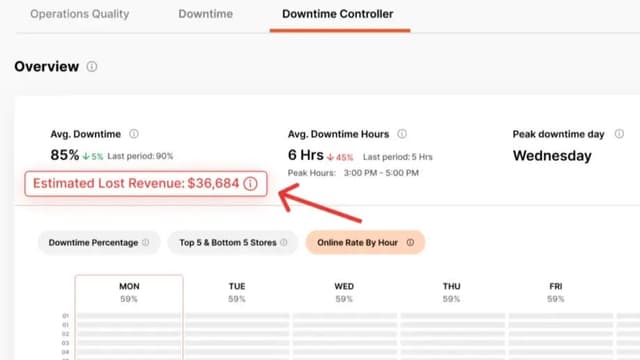
A period when the store was unexpectedly offline is not normal demand. Mark it as suppressed demand instead of treating the lower order count as a clean baseline.
If you are unsure whether a weak period was demand or execution, first diagnose a delivery sales drop.
Cancellations and acceptance problems
Track placed orders, accepted orders, completed orders, and cancellations separately when the data is available. A spike in canceled orders can signal real customer demand that the operation failed to fulfill.
Promotions and advertising
Label every historical period that had a promotion or meaningful ad change. Do not compare a discounted Friday with a full-price Friday and call the difference seasonality.
Before using a promotion lift as a future adjustment, measure delivery app promotion ROI and determine whether the lift was truly incremental.
Calendar and local events
Federal and provincial holidays, school breaks, sports, concerts, conventions, paydays, and tourism can shift demand. Keep only the events that have shown a repeatable effect for that location.
Weather
Weather belongs in the review, but not as a universal multiplier. A 2025 study found weather and daypart useful for predicting hot- and cold-drink sales, but not total sales in that dataset. Test the effect on your own concept. (PMC)
For Canadian locations, include snow, extreme cold, and tourism patterns. Restaurants Canada’s 2025 trends report also highlights changing affordability and digital-first behavior, so recent local history deserves more weight than a national assumption. (Restaurants Canada)
How do you build a weekly delivery demand forecast?
Use this seven-step process:
- Choose the forecast unit. Start with completed orders by location, marketplace, and daypart.
- Pull comparable periods. Compare Tuesdays with Tuesdays, dinner with dinner, and the same channel with itself.
- Remove distorted periods. Flag downtime, unusual closures, major listing errors, one-off catering orders, and promotion spikes.
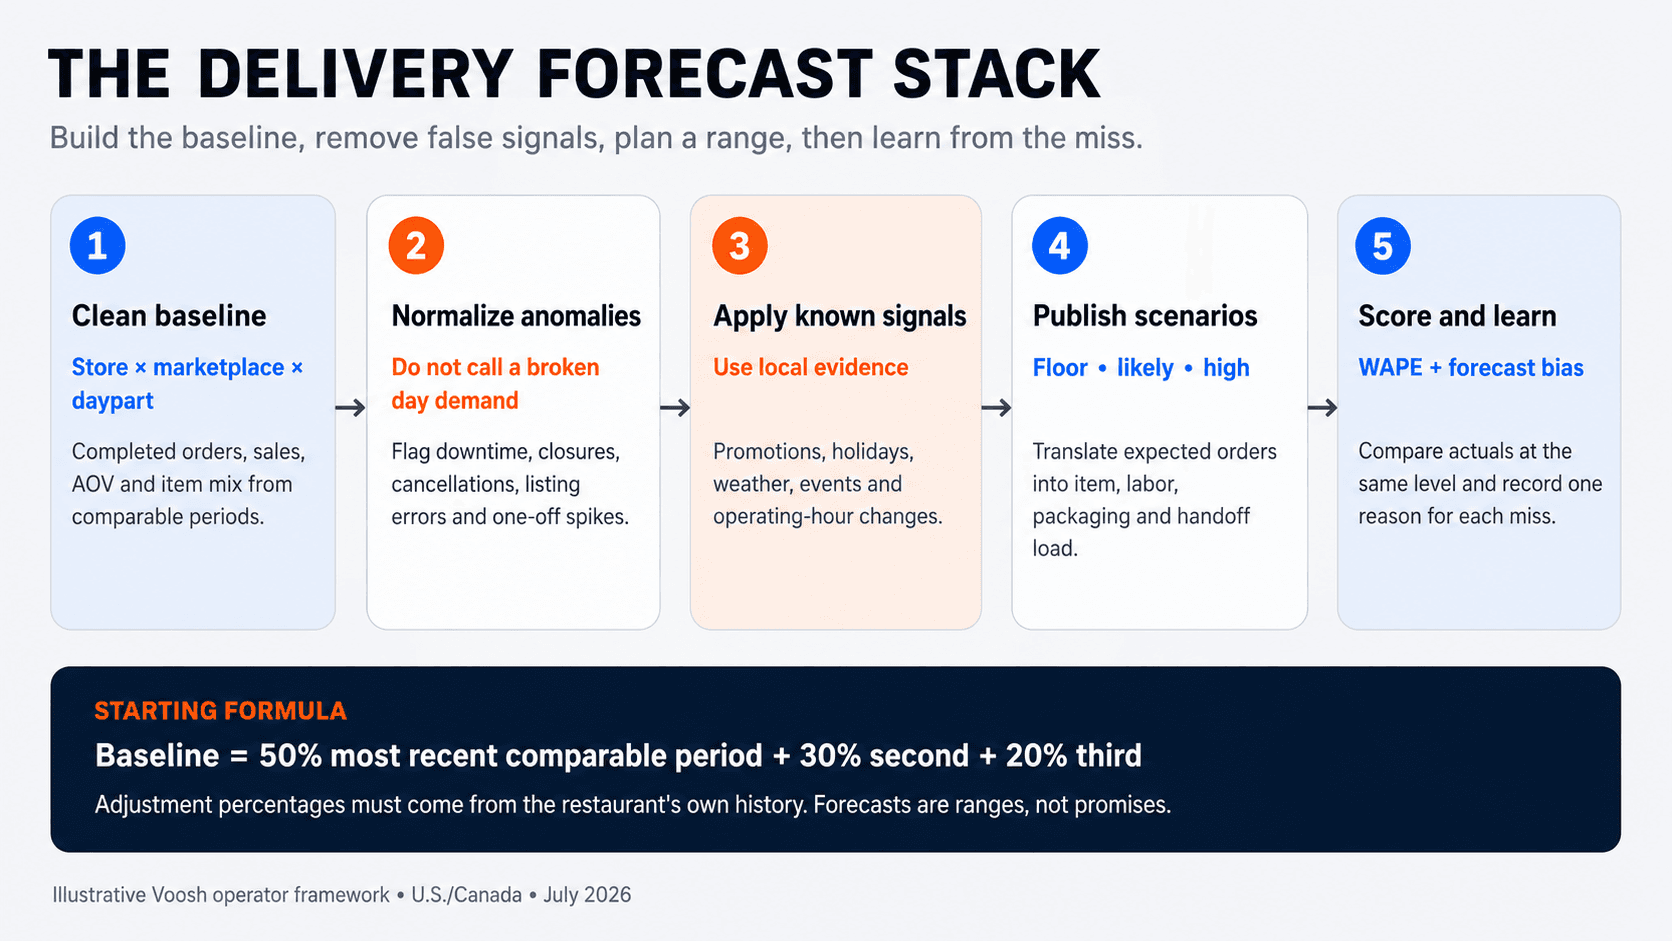
- Calculate a weighted baseline. Give more weight to the most recent clean comparable period.
- Add known adjustments. Apply local factors for a scheduled promotion, holiday, event, weather pattern, or operating-hours change.
- Publish three scenarios. Give teams a floor, likely case, and high-demand case.
- Compare actuals and record the reason for the miss. The explanation is what improves next week’s forecast.
Run the process on the same day every week. A forecast that is updated casually will become another spreadsheet nobody trusts.
What simple forecasting formula can a restaurant use?
An independent operator can start with a weighted moving average:
Baseline forecast = (last comparable period x 50%) + (two periods ago x 30%) + (three periods ago x 20%)
Example: a restaurant is forecasting Friday dinner delivery orders for one marketplace.
- Last clean Friday: 118 orders
- Two Fridays ago: 110 orders
- Three Fridays ago: 104 orders
The baseline is:
(118 x 0.50) + (110 x 0.30) + (104 x 0.20) = 112.8 orders
Round the likely case to 113 orders.
Now assume the restaurant has a promotion scheduled. Its own past results show that the same promotion produced an 8% incremental order lift at this location after removing orders that likely would have happened anyway.
Adjusted likely forecast = 113 x 1.08 = 122 orders
That 8% is a local planning assumption, not an industry benchmark. Without reliable history, keep the baseline and widen the scenario range.
For example:
- Floor: 110 orders
- Likely: 122 orders
- High: 134 orders
How should the forecast change staffing and prep?
Do not hand the kitchen only a sales number. Translate the forecast into orders, items, and arrival windows. If one order averages 2.4 items, 122 forecast orders represent roughly 293 items, but the item mix still determines prep, cook, packaging, and handoff load.
Use the likely scenario for the core plan:
- Prep quantities for the expected item mix.
- Labor coverage for the busiest 30- or 60-minute window.
- Packaging and label supply.
- A pickup-area capacity check.
- A backup action if volume reaches the high case.
The high scenario should trigger a specific response, such as opening a second packing position or moving a cross-trained employee to expo.
For known event spikes, pair the forecast with the playbook to prepare for peak delivery demand.
How do you know whether the forecast is improving?
Track forecast accuracy at the same level where the decision was made.
If the team forecast Friday dinner by store and marketplace, do not score the result using total weekly brand sales. A good location can hide a bad location in the roll-up.
Two metrics are enough to start.
Weighted absolute percentage error
WAPE = total absolute forecast error / total actual orders x 100
If four locations forecast 500 total orders and the combined absolute error is 60 orders, WAPE is 12%.
Lower is better, but there is no universal “good” percentage. Set a baseline and improve against your own history.
Forecast bias
Bias = (total forecast orders - total actual orders) / total actual orders x 100
Positive bias means the team consistently over-forecast. Negative bias means it under-forecast.
WAPE tells you how far off the forecast was. Bias tells you which direction the misses lean.
Add one reason code to every material miss:
- Promotion performed differently
- Store downtime
- Weather effect
- Event effect
- Listing or menu issue
- Staffing or acceptance constraint
- Unexplained
After several weeks, those notes often matter more than another layer of math.
How should multi-unit teams scale the process?
Use one forecasting language across the brand, then let local evidence change assumptions.
Corporate or regional teams should define:
- The forecast unit and daypart boundaries.
- Which order statuses count.
- How downtime and cancellations are treated.
- Which promotions require a separate baseline.
- The scenario format.
- The accuracy metrics and review cadence.
Store managers should own local adjustments for events, road closures, campus calendars, weather, and unusual operating conditions. Every override needs a reason.
A practical cadence is:
- Monday: central team publishes the baseline.
- Tuesday: stores add approved local adjustments.
- Wednesday: regional leaders review large exceptions.
- Daily: actuals replace assumptions and major misses receive a reason code.
- Monthly: the team reviews WAPE, bias, and recurring root causes by location.
That turns forecasting into a management process instead of a spreadsheet exercise.
Which forecasting mistakes create false confidence?
- Blending every channel: Keep dine-in, pickup, first-party delivery, and each major marketplace separate until the operating plan is built.
- Treating downtime as low demand: If customers could not order, replace that period with a clean comparable baseline.
- Copying promotion lift across stores: Use local evidence, not the portfolio average.
- Forecasting dollars but staffing orders: Kitchen workload follows tickets, items, and arrival concentration.
- Using one exact number: Publish floor, likely, and high cases.
- Ignoring the reason for a miss: Without a reason code, the same error returns next week.
How can Voosh support a cleaner delivery forecast?
Forecasting depends on a reliable historical picture. That becomes harder when sales, cancellations, promotions, reviews, and store availability live in separate marketplace portals.
Voosh helps connected restaurant teams review delivery sales, mix, cancellations, and marketplace performance by store, channel, and daypart. Depending on enabled modules, teams can also examine store uptime, reviews, and ads or promotions. VooshGPT can help operators investigate what changed and why actual demand differed from plan.
That makes Voosh useful at two points:
- Before the forecast: build a cleaner marketplace baseline.
- After the forecast: investigate the variance instead of labeling every miss “demand.”
Voosh does not replace a POS, inventory platform, labor scheduler, weather feed, or marketplace setup process. It provides a more connected view of delivery signals.
For the broader reporting foundation, see the restaurant dashboard for delivery operators.
Turn forecasting into a weekly operating habit
Restaurant demand forecasting does not need to start with AI. Begin with a clean unit of analysis, three comparable periods, transparent adjustments, and a weekly accuracy review.
The big shift is simple: stop forecasting the restaurant as one number. Forecast the location, marketplace, and daypart that will create the work.
When the baseline is clean and every miss has a reason, the forecast becomes more useful each week. Prep gets tighter and teams spend less time reacting.
Want to see how Voosh connects delivery performance across stores and marketplaces? Book a demo.